Trade shows, investor forums, VIP galas and city showcases all have the same problem: too many distractions, not enough attention. To win that attention today, events are shifting from “screens & booths” to living, responsive environments where content reacts to visitors in real time.
In this article, we’ll walk through how live events actually integrate interactive technologies from touchscreens and tangible tables to spatial sensors, computer vision and hybrid layers and how to tie them into a single ecosystem that marketing, IT and the C-suite all understand.
TL;DR – Why Live Events Are Becoming “Interactive by Default”
-
Audiences don’t want to just watch anymore – they expect to touch, swipe, wave, scan and share at events.
-
Research shows interactive and live formats significantly outperform static content in engagement, time spent and conversion.
-
As a result, interactivity is no longer a gimmick; it’s the baseline expectation for trade shows, forums, sales galleries and city showcases.
-
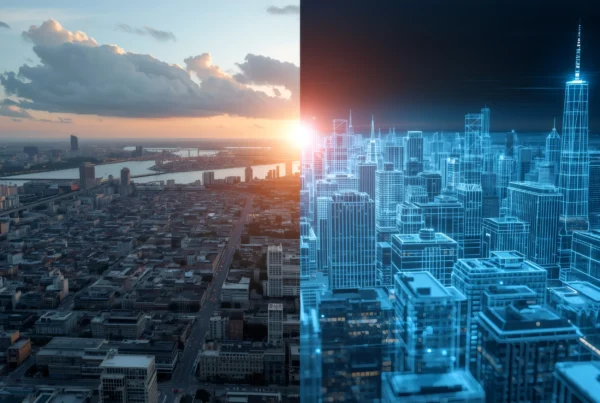
Immersive and experiential technologies are shifting events from “screens on walls” to responsive environments that react to visitors in real time.
Why Live Events Are Becoming “Interactive by Default”
Audience behaviour has changed. Visitors now expect to touch, swipe, wave, scan and share – not just stand and watch.
Research on interactive content and live formats consistently shows that:
-
Interactive content delivers significantly higher engagement than static assets, with users more likely to interact, remember and return.
-
Viewers spend more time with live, participatory formats than with pre-recorded video and are more likely to buy after engaging with them.
In other words:
Interactivity isn’t a “nice add-on” anymore — it’s the default expectation.
We explore this shift in more detail in our guide
Immersive Solutions 101: A Beginner’s Guide to Experiential Tech, where we look at how immersive and experiential technologies change visitor behaviour.
This article focuses on the plumbing behind those experiences: how different interactive technologies actually connect and work together in a live event.
A Simple Framework: Front-of-House, Back-of-House & Data Layer
A useful way to understand interactive ecosystems is to divide them into three layers:
1. Front-of-house (FOH) – What Guests See and Touch
This is the visible layer:
-
4K touchscreens and multitouch tables
-
Interactive walls and LED canvases
-
Tangible object-recognition tables
-
Motion and spatial sensors in tunnels and rooms
-
VR/AR stations, headsets, domes
-
NFC wristbands, smart badges, mobile apps
2. Back-of-house (BOH) – The Engines and Control
This is where content is rendered and orchestrated:
-
Real-time engines (for example Unreal Engine powering digital twins and 3D worlds)
-
Media servers managing timelines and high-res video
-
Show-control systems that synchronise content, lighting and sound
-
Content management tools for updating text, media and data
3. Data Layer – How You Measure Return on Events
This is the glue between experience and business:
-
Analytics dashboards (interactions, dwell time, flows)
-
Integrations with CRM and marketing automation
-
Event ROI and Return on Events (ROE) models
The events community increasingly talks about ROE — looking not just at leads generated, but at relationship capital, knowledge exchange and long-term value. PCMA’s resources on ROE are a good starting point for building your own measurement framework.
At Chameleon Interactive, we like to combine this three-layer model with customer journey mapping, as described step-by-step in
Customer Journey Mapping for Experiential Events – The Complete 101 Guide.
Touchscreen Ecosystems: From Info Kiosks to Interactive Walls
Touchscreens remain the workhorse of interactive events because everyone instinctively knows how to use them.
Typical Roles for Touch-Based Interfaces
Information kiosks
Used for wayfinding, FAQs, service directories, or quickly browsing a portfolio. These often sit at pavilion entrances or in shared information zones.
Multitouch tables
Ideal for collaborative exploration: zooming around a 3D city model, comparing apartment layouts, viewing infrastructure layers, switching between languages and data overlays.
Large interactive walls
Great for the “attract” phase: animated 3D scenes or bold messaging that stop people in the aisle, then invite them to interact via touch zones, QR codes or mobile triggers.
Our offers
Smart Audiovisual Solutions and
Smart Interactive Solutions show how we treat screens as part of a complete ecosystem, rather than isolated widgets.
How Touchscreens Integrate With the Rest of the System
Under the hood, a typical integration flow looks like this:
-
The touchscreen runs a front-end application (often powered by a real-time engine such as Unreal Engine or a web framework).
-
Every tap, swipe or selection generates an event (for example, “Sustainability – Mobility – Riyadh Metro”).
-
These events can:
-
Trigger synchronised content on a larger canvas (LED wall, projection, ceiling)
-
Log interaction data for analytics (what was viewed, for how long, and in what order)
-
Connect with CRM or lead-forms to link interactions with specific visitors
-
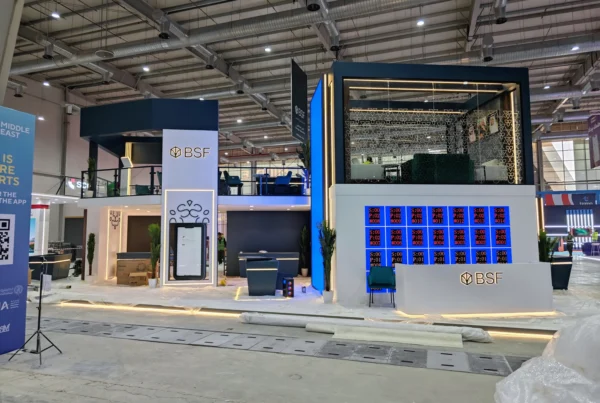
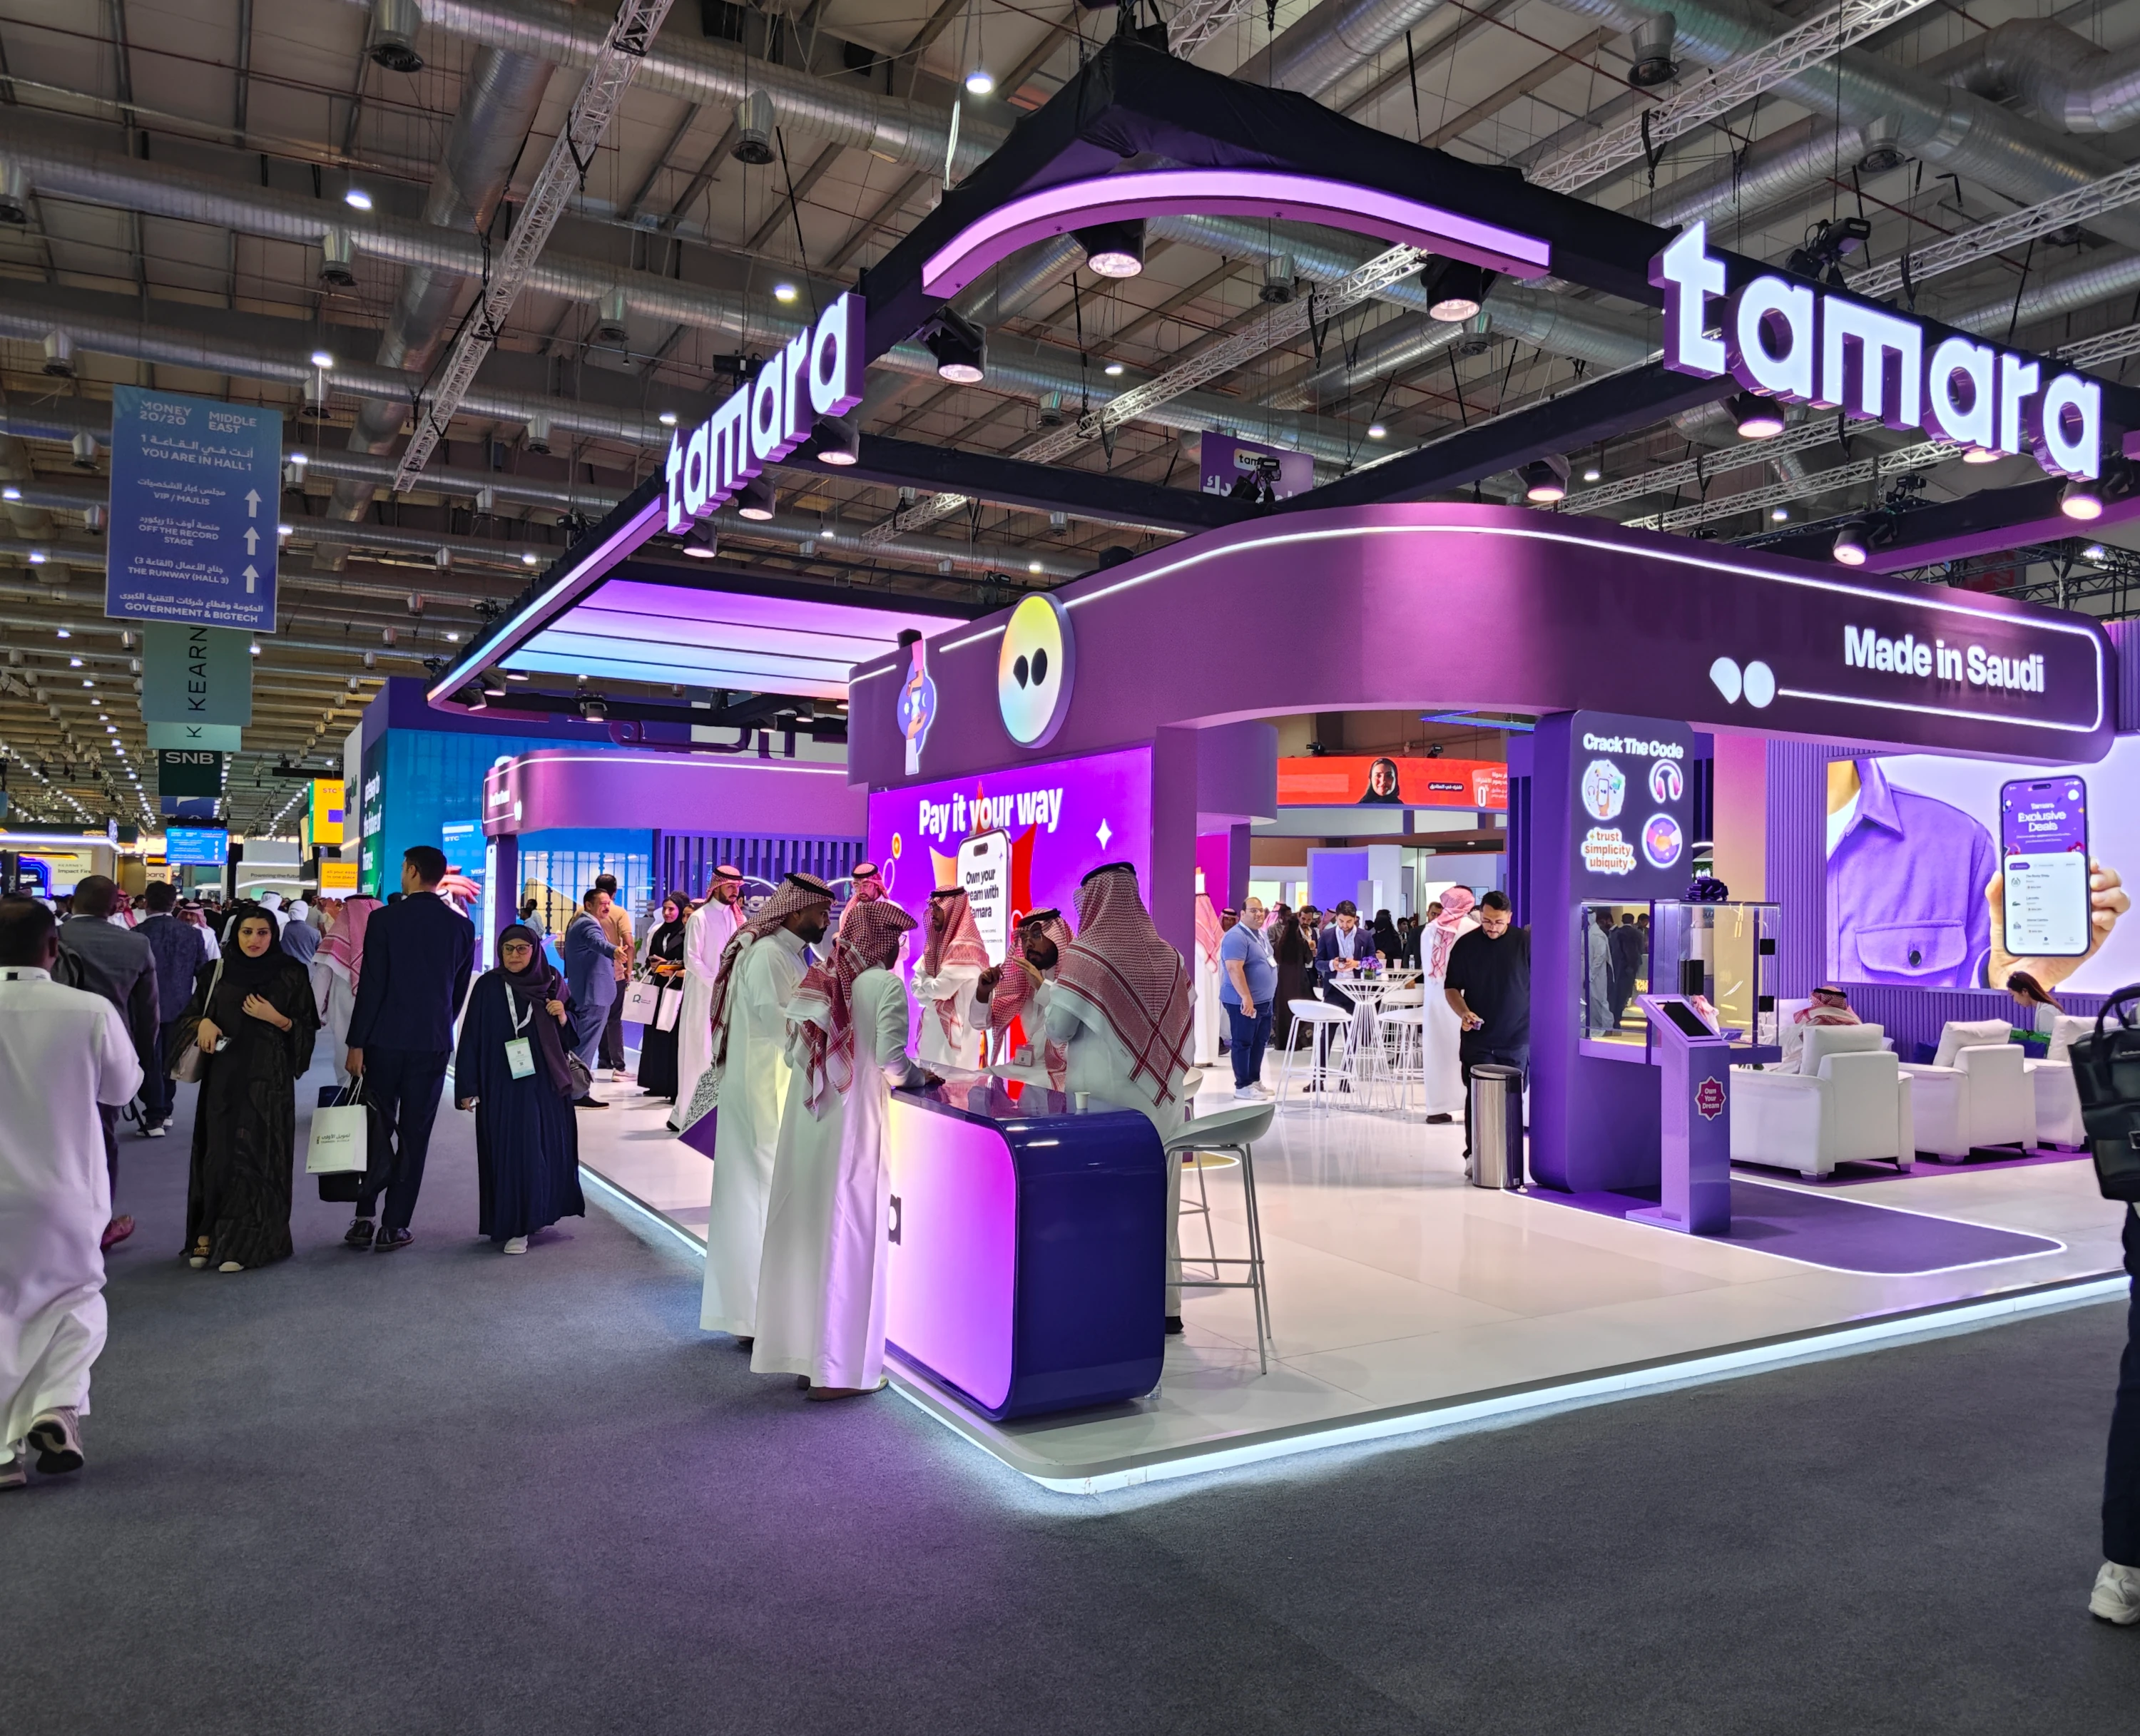
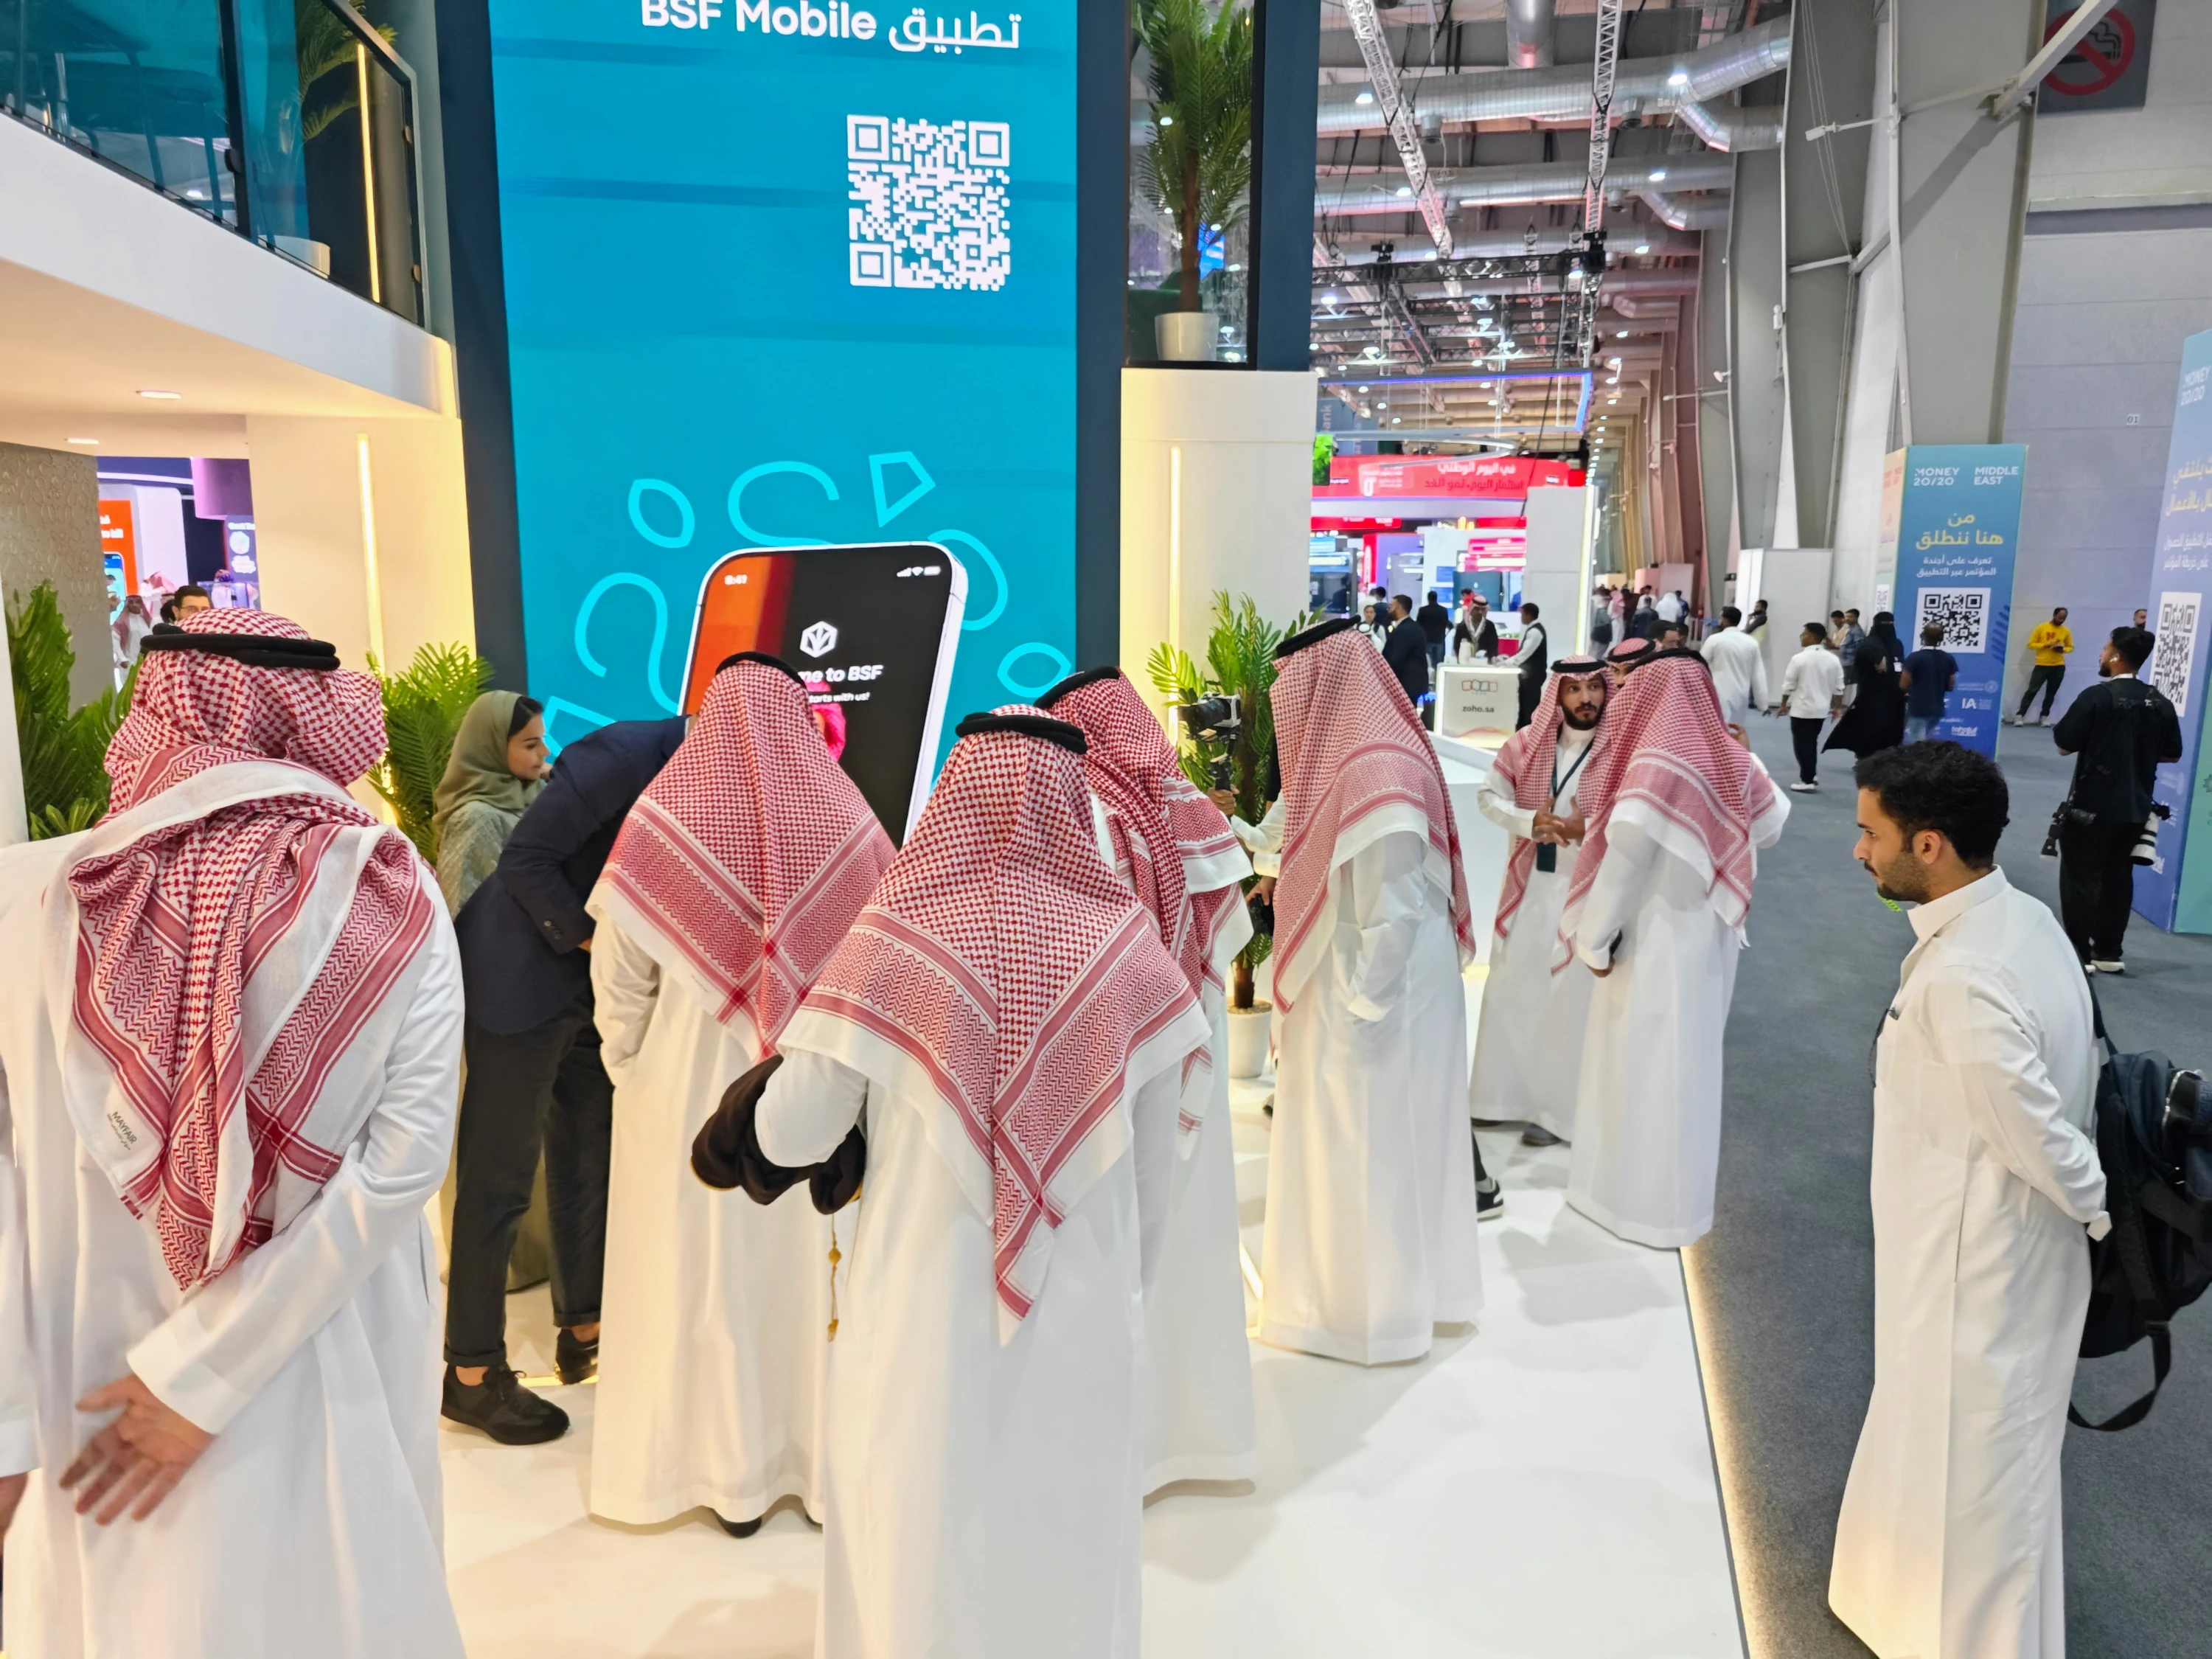
A concrete example is our project
Behind the Scenes: BSF’s Interactive Booth at Money20/20 Riyadh, where a vertical “mega phone” app explorer and other interactive points were all orchestrated to tell one coherent story and feed a shared analytics layer.

Tangible Tables & Object Recognition: Turning Tokens Into Stories
Tangible interfaces — where visitors place and rotate physical objects on a table — combine the intuitive feel of physical models with the flexibility of digital content.
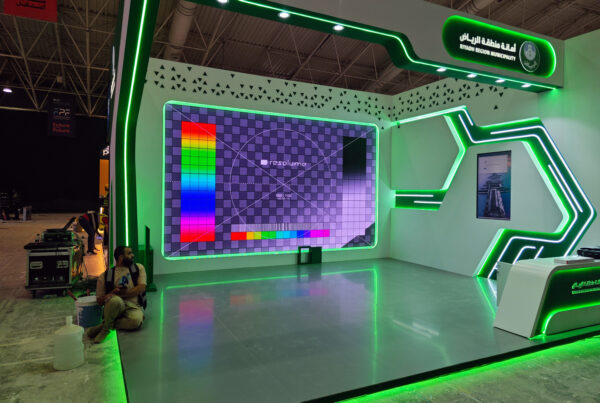
In our project
Interactive Solutions With Table Object Recognition for AECD 2025,
we created an interactive table where each token represented a key theme for the future of Riyadh.
How Tangible Object Recognition Works
A typical tangible table has three key parts:
Physical tokens or models
Each token maps to a topic or story: sustainability, smart mobility, culture, tourism, investment, and so on.
Sensing layer
The table uses RFID, NFC or computer vision to detect:
- Which token is on the surface
- Where it is placed
- Sometimes its rotation or combination with other tokens
Content engine and displays
The system looks up the token ID and triggers the corresponding content on:
- The tabletop itself (maps, diagrams, contextual info)
- A vertical LED wall or projection that amplifies the story for onlookers
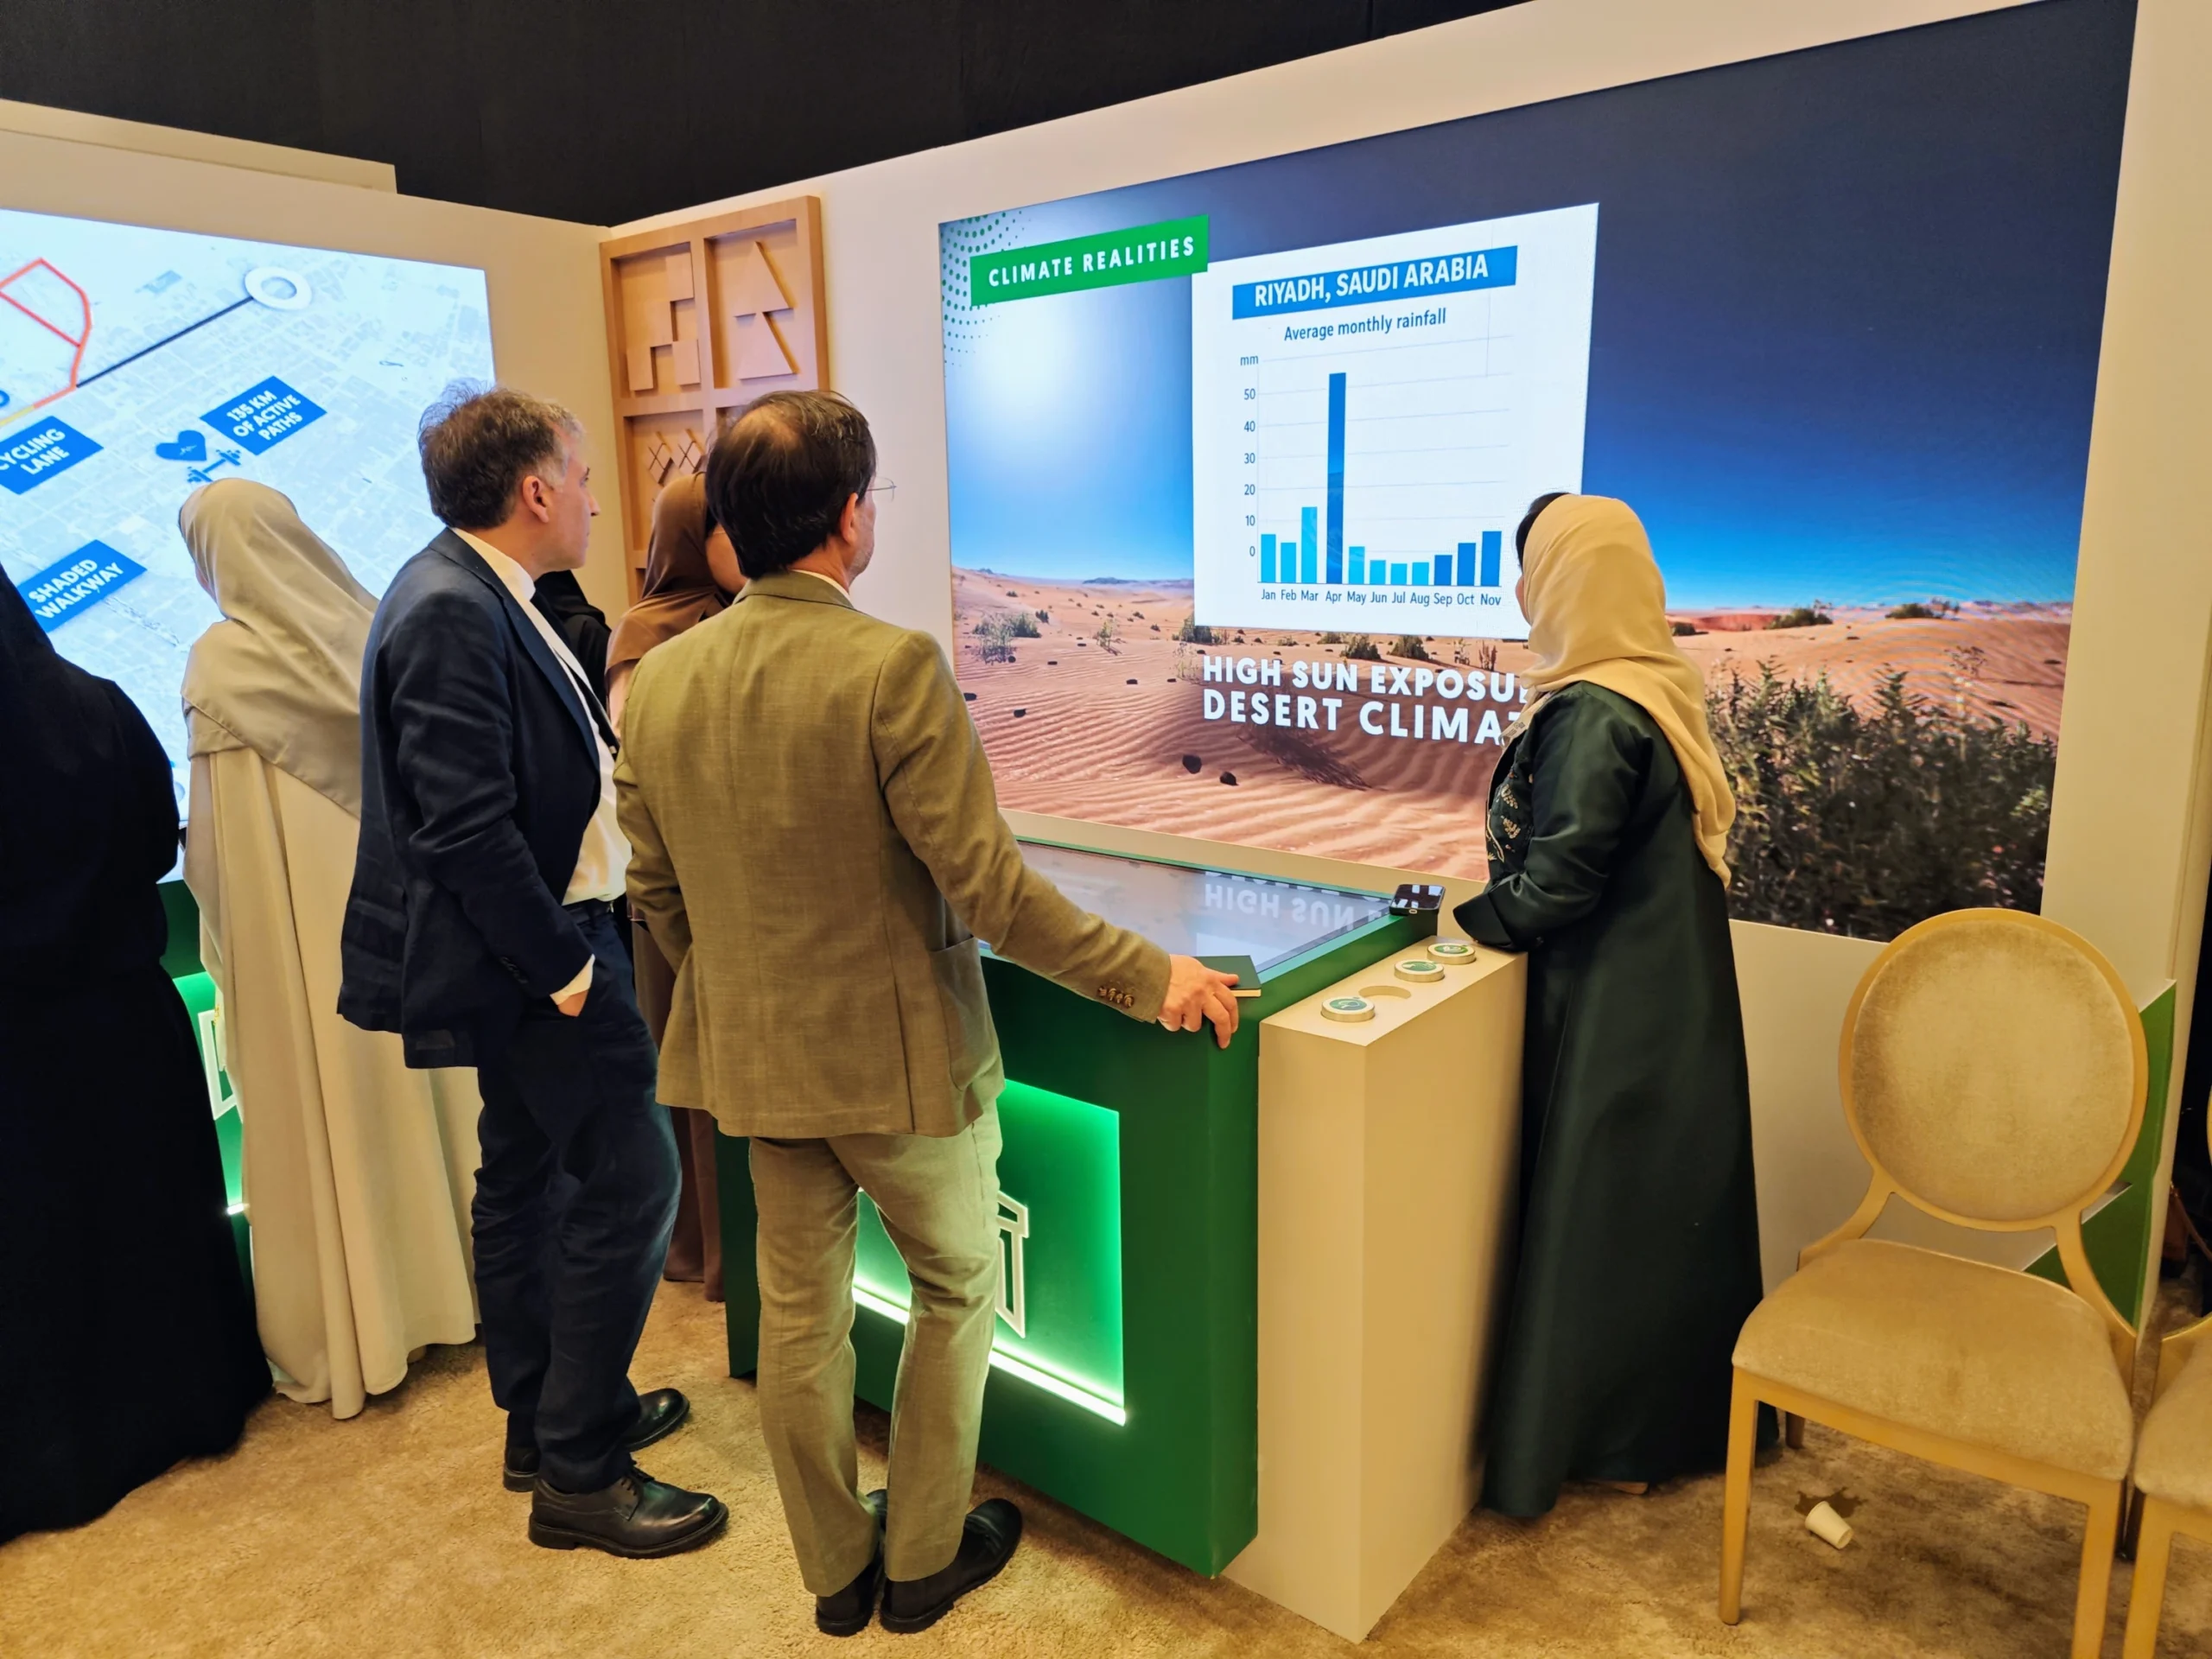
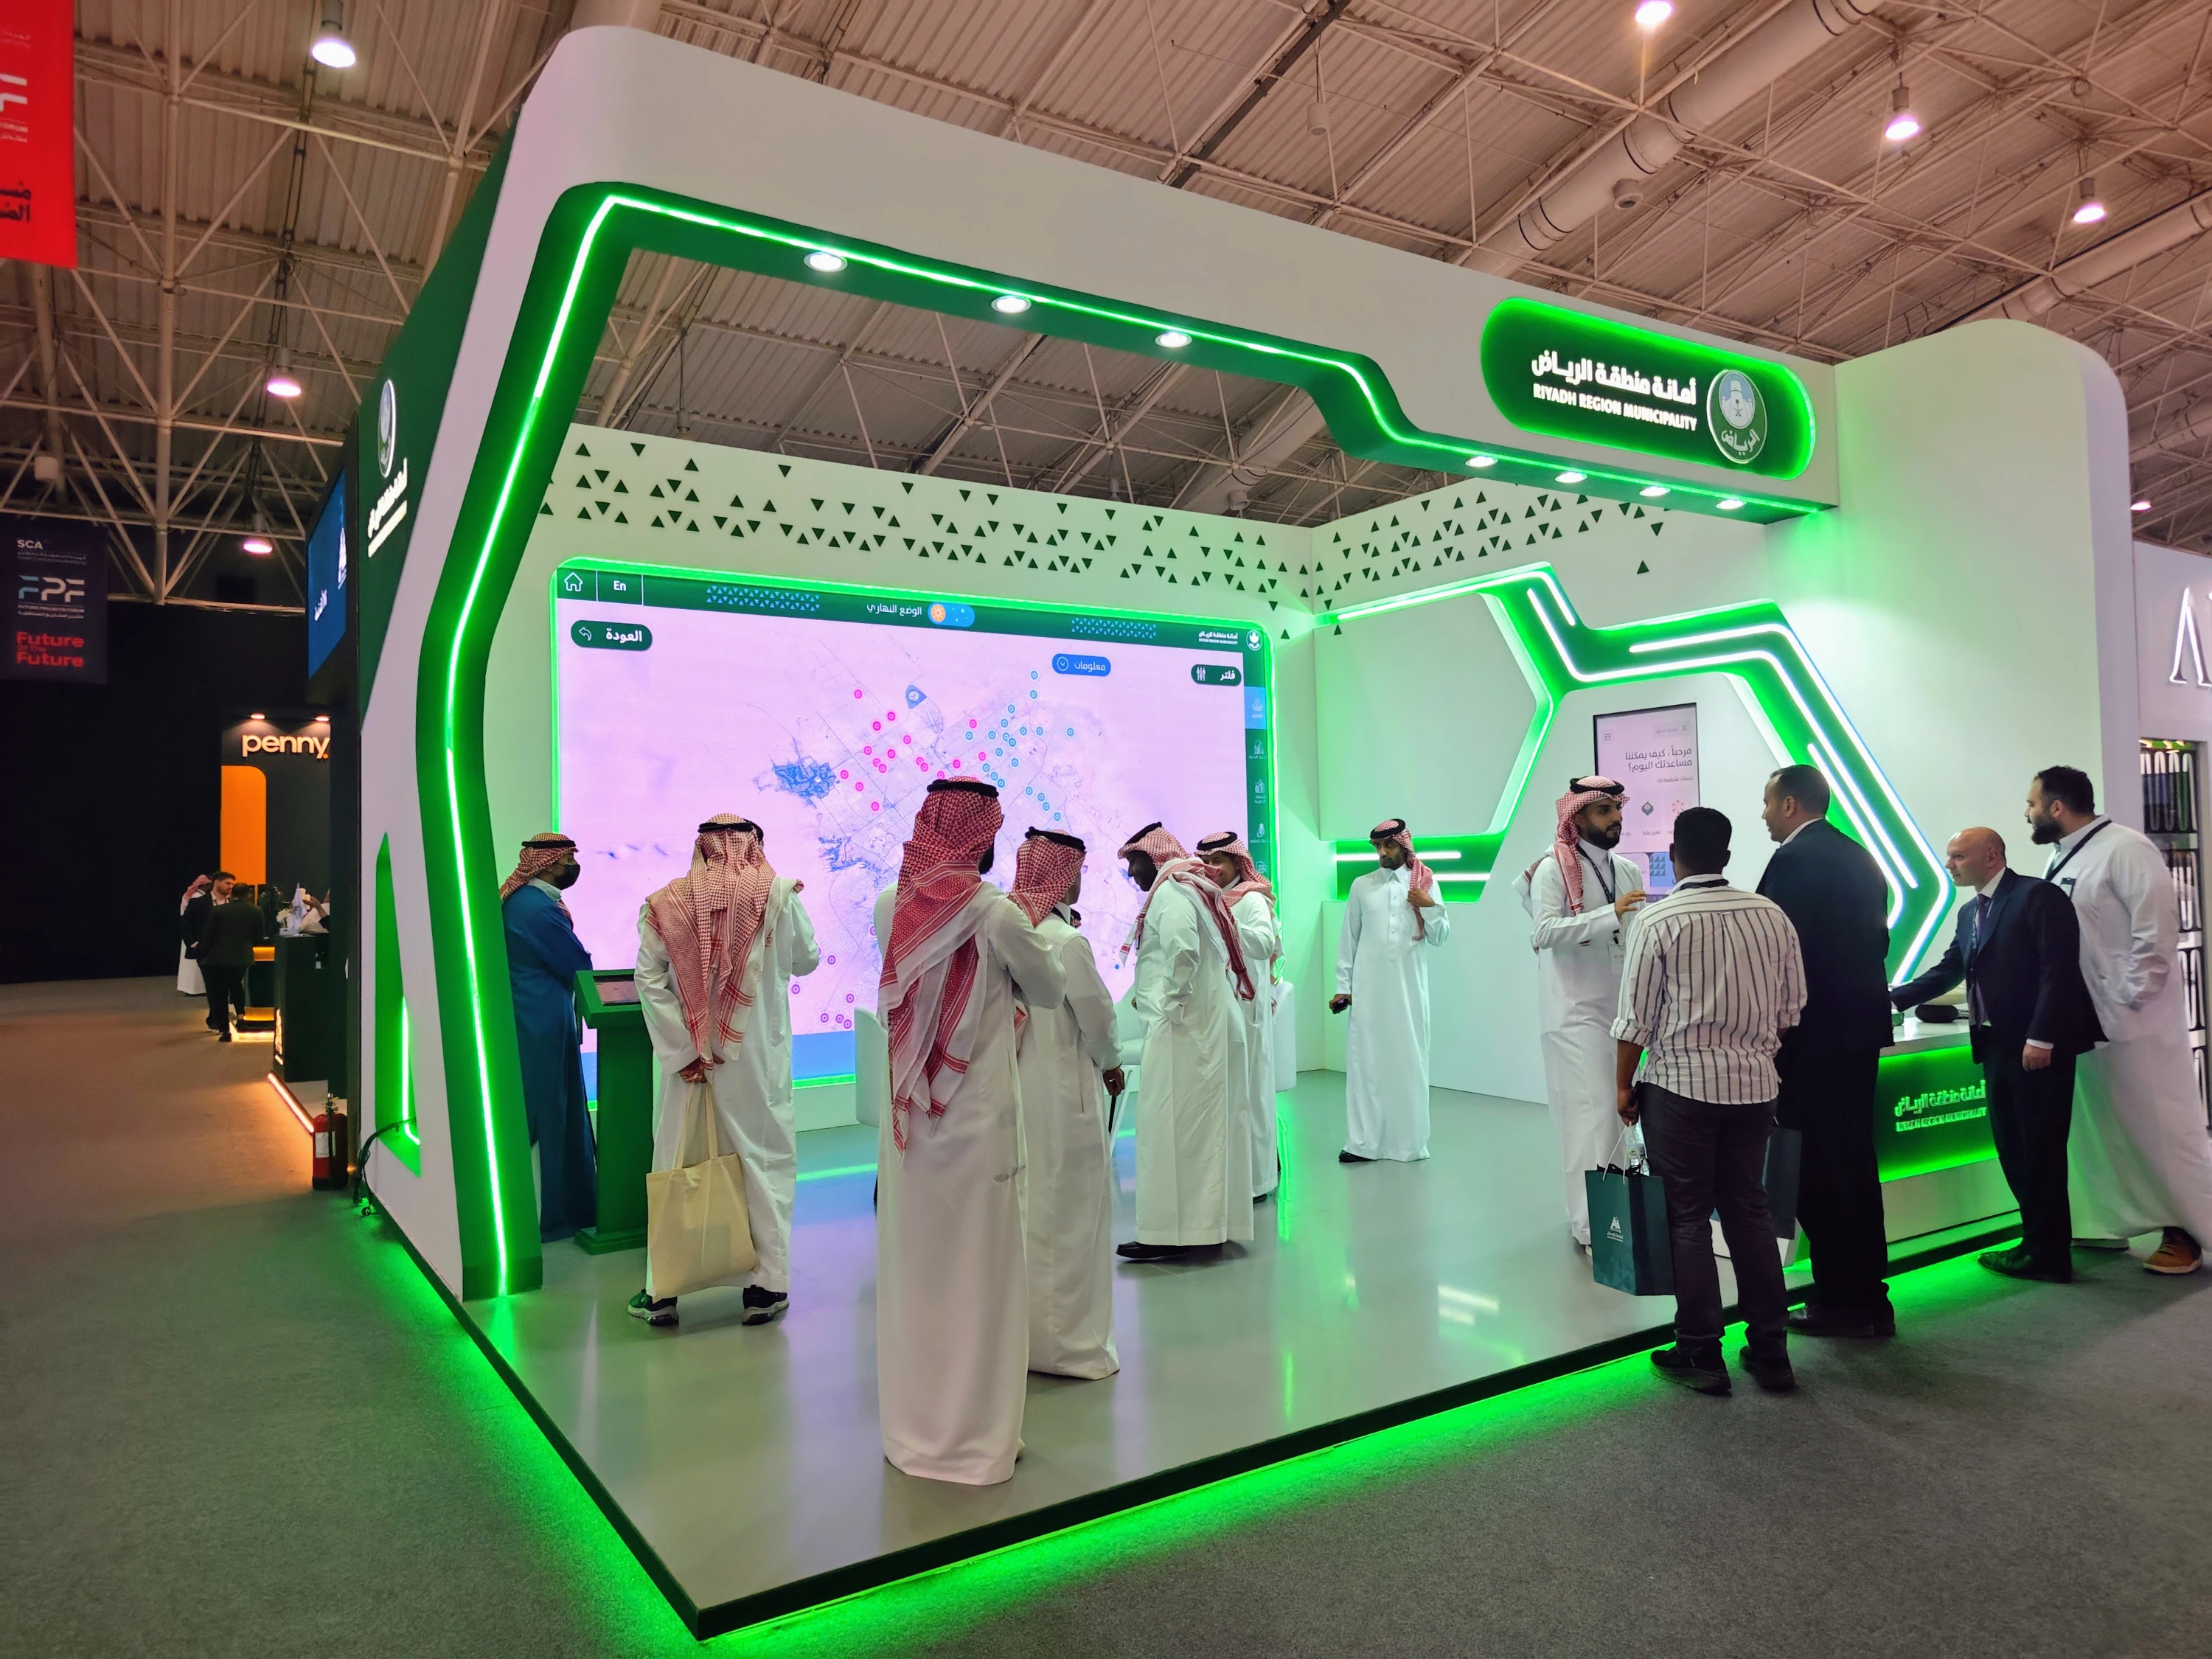
At AECD 2025, tangible tokens triggered multiple short animations and data overlays connected to the Riyadh Digital Twin, allowing visitors to explore the city’s future through physical interaction. We describe the integration between table and digital twin in more detail in
Behind the Scenes: Activating the Riyadh Digital Twin at Future Projects Forum.
Why Tangible Interfaces Perform So Well
Tangible tables work particularly well at forums and government or real estate showcases because they:
-
Naturally invite collaboration – several people can stand around and explore together
-
Provide strong visual hooks for PR and social media
-
Generate clean interaction analytics – every token placement and removal is an explicit choice
For real estate and mixed-use projects, we expand on this approach in
Interactive Exhibitions for Real Estate Developers: A New Era of Property Showcasing.
Motion Tracking & Spatial Sensors: Making Content React to People
Touchscreens and tokens require a conscious action. Spatial sensors allow content to respond even when visitors don’t touch anything.
What Are Spatial Sensors?
In live events and themed spaces, spatial sensing commonly includes:
-
Motion sensors
PIR or ultrasonic sensors detect when someone enters a defined zone. -
LiDAR and depth cameras
These measure distance and shape, enabling people-counting and position tracking. -
Floor pressure sensors
Embedded in platforms or kinetic floors, they detect footsteps and weight shifts. -
Optical or infrared tracking systems
Used for gesture control, such as waving or pointing to trigger content.
AV integrators and experience designers increasingly use these tools to create responsive media environments where projections, lighting and soundscape change as visitors move through the space.
How Spatial Sensors Are Used in Events
Some common patterns:
-
Zone-based storytelling
Entering a tunnel or archway automatically starts a themed animation sequence on LED walls. -
Reactive floors and walls
Visuals ripple, bloom or follow visitors, creating a playful path. -
Heatmapping and optimisation
Sensor data feeds into heatmaps, showing where people stop, cluster or walk past quickly. Organisers use this to adjust booth layout, staffing and content placement.
In our
Immersive VIP Event Solutions: Experiential Marketing Beyond Interaction, we explore how spatial sensors, projection mapping and spatial audio combine to create rooms that seem to “breathe” with the presence of each guest, rather than waiting for someone to press a button.
Computer Vision & AI: Seeing and Understanding the Crowd
The next step beyond basic sensors is computer vision — using cameras and AI to extract meaningful information from the scene.
What Computer Vision Enables at Events
-
People counting and dwell time
Measuring how many people enter a zone, when, and how long they stay. -
Heatmaps and flow visualisation
Showing which paths through the booth are most popular and where bottlenecks form. -
Gesture-based interaction
Detecting waves, arm raises or hand movements to drive content on screens and projections. -
High-level audience insight (with caution)
In some contexts, vision systems can estimate rough audience demographics or sentiment, though this must be handled with strong ethical and legal safeguards.
Real-time visual tools such as Notch illustrate how camera and sensor data can be connected to live-generated 3D graphics and media servers, enabling visuals that react instantly to crowd movement.
Ethics and Privacy
When using computer vision and AI, there are important principles to follow:
-
Clearly communicate to visitors when cameras and analytics are in use.
-
Focus on aggregate metrics (counts, dwell, heatmaps) rather than identifying individuals.
-
Avoid storing identifiable footage longer than necessary.
Our guide
Immersive Solutions 101 approaches technology as a tool for better experiences and better decisions, not surveillance a principle we apply in every computer-vision-driven project.
Mobile, Wearables & Hybrid Layers
Interactive technology no longer stops at the edge of the booth. Phones, badges and hybrid features extend the experience before, during and after the live moment.
Wearables and Smart Badges
NFC or RFID-based wristbands and badges let organisers:
-
Log entry into zones or specific activations
-
Trigger content when a visitor taps a plinth, kiosk or pedestal
-
Unlock premium content, prize draws or personalised journeys
When wearable interactions are connected to CRM, they enable analysis such as:
-
Which roles (e.g. investors, media, partners) engaged most with specific topics
-
How engagement at the stand correlates with post-event meetings or deals
Mobile and Hybrid Experiences
Mobile devices play several roles:
-
Second screen
While a large LED wall shows a hero story, the mobile app delivers deeper technical details or spec sheets. -
Remote control
Visitors collectively choose story branches or vote for scenarios that then appear on the main screen. -
AR layer
Smartphones reveal extra layers on physical models, printed graphics or maquettes.
Interactive live streaming platforms and hybrid event tools show that adding interactivity — polls, questions, micro-quizzes — significantly increases watch time and conversion rates compared with one-way streams.
We discuss the broader customer-experience impact of these tools in
5 Ways Immersive Event Technology Enhances Your Customer Experience Strategy.
Under the Hood: Integrating Everything Into a Single System
Connecting touchscreens, tokens, sensors, cameras, wearables and LED walls into one coherent ecosystem is where many projects succeed or fail.
A Typical Integration Architecture
A robust integration usually includes:
Input layer
- Touchscreens, tangible tables, VR/AR stations
- Spatial sensors, LiDAR and cameras
- NFC wristbands and badges
Middleware / show-control layer
- Receives events from all inputs
- Decides which scenes, lights, sounds or devices to trigger
- Keeps timing synchronised across all outputs
Content engines and media servers
- Unreal Engine scenes for digital twins and complex 3D storytelling
- Real-time graphics tools (such as Notch) connected to media servers and LED processors
Analytics & data
- Logs all interactions and sensor events
- Aggregates metrics in dashboards
- Pushes relevant data into CRM and marketing platforms
Our
Digital Twin Solutions overview explains how a single Unreal Engine build can drive LED walls, touchscreen totems, VR tours and remote streaming from the same core dataset, while maintaining consistency across them.
In practice, we often deploy this approach across multiple events, as described in
From Concept to Reality: Planning a Complete Immersive Booth Experience. The same core assets and integration logic can be reused with new content, reducing cost and increasing consistency over time.
Measuring Impact: From Dwell Time to Return on Events
All of this technology only makes sense if it moves real business and communication metrics.
Key Metrics for Interactive Technologies
Some of the most useful metrics include:
-
Dwell time
How long visitors stay in the stand or in specific zones. -
Engagement rate per activation
What percentage of visitors interact with each experience (touch, token, VR, quiz). -
Path and heatmap analysis
Which paths are used most, where people slow down, where traffic drops off. -
Lead quality
Not just number of leads, but role, decision power and project timeline. -
Return on Events / Return on Objectives
Frameworks that mix financial ROI with relationship-building and knowledge transfer.
We address measurement and analytics in detail in two companion articles:
-
Immersive Solutions 101 – focusing on NPS, surveys and dashboard design
-
From Concept to Reality: Planning a Complete Immersive Booth Experience – covering KPIs, live dashboards and post-event learning loops
Practical Roadmap: From Idea to Integrated Experience
To close, here is a practical roadmap for integrating interactive technologies into your next event.
1. Define Objectives and KPIs
-
What must this event achieve? (sales leads, investor confidence, citizen engagement, etc.)
-
Which behaviours indicate success? (time spent, demos completed, stories explored, meetings booked)
2. Map the Attendee Journey
Use the framework in
Customer Journey Mapping for Experiential Events – The Complete 101 Guide to design the “Attract → Engage → Convert → Follow-up” flow across physical and digital touchpoints.
3. Select Interaction Types for Each Moment
-
Attract – large-format LED, projection, spatial sound, motion-reactive elements
-
Engage – touchscreens, tangible tables, VR/AR capsules, gesture-driven installations
-
Convert – guided demos, configurators, interactive forms and appointment booking
4. Design the Technology Stack
-
Decide which experiences will share a core Unreal Engine build or other real-time engines.
-
Plan a show-control and middleware layer to keep all devices synchronised.
-
Align with local AV and fabrication partners early on integration and cabling.
5. Prototype and Test
-
Run off-site tests to check sensor reliability, latency and failover.
-
Simulate heavy visitor flow to validate stability.
-
Refine interaction design based on observation.
6. Instrument Data From Day One
-
Decide what will be tracked and how: touches, token placements, sensor triggers, badge taps.
-
Prepare dashboards for on-site optimisation and post-event reporting.
7. Reuse and Evolve
-
Treat interactive assets as capital, not one-off cost.
-
Reuse and adapt the same ecosystem across multiple events with updated content.
-
Look for patterns: which narrative structures and technologies consistently deliver the best ROE.
You can explore how this approach plays out in real projects in our
Projects section, where we document digital twins, tangible tables and immersive booths delivered for clients across the Middle East and Europe.
For common mistakes and risk factors, see also
Avoiding Common Pitfalls for Successful Smart and Immersive Interactive Solutions at Trade Fairs.
FAQ: Interactive Technologies in Live Events
1. What are examples of interactive technologies used in live events?
Typical interactive technologies include 4K touchscreens, multitouch tables, tangible object-recognition tables, interactive walls, VR/AR pods, NFC wristbands, LiDAR-based motion tracking and computer-vision-based heatmaps. These tools are often orchestrated together via real-time engines and show-control systems so that screens, lights and sound respond coherently to visitor behaviour.
2. How do motion sensors and spatial sensors work in event installations?
Spatial sensors such as PIR detectors, LiDAR and depth cameras detect where and how visitors move through a space. When a person enters a zone or makes a gesture, the sensor sends a signal to the show-control system, which then changes visuals, lighting or audio. This is how walk-through tunnels, reactive floors and responsive projection rooms come to life.
3. Is interactive event technology only for big trade shows?
No. While large trade shows and expos are obvious candidates, interactive technologies are also used in sales galleries, showrooms, museums, visitor centres, corporate lobbies and VIP dinners. The difference is usually in scale: a showroom might focus on one or two signature experiences instead of a full 270° LED environment.
4. How do you measure the success of interactive technologies at events?
Success can be measured through dwell time, engagement rates per activation, lead quality, heatmaps of movement, and qualitative feedback such as NPS and open comments. Many organisations also use Return on Events (ROE) frameworks that combine financial ROI with objectives like relationship-building, education and reputation.
5. What’s the difference between interactive, immersive and experiential solutions?
-
Interactive solutions respond directly to user input (touch, gestures, tokens).
-
Immersive solutions surround the user with visuals, sound and sometimes haptics or XR.
-
Experiential solutions combine story, space, people and technology into a coherent journey.
We break down these differences in detail in
What’s the Difference Between Interactive, Immersive, and Experiential Solutions?.