Customer journey mapping is no longer limited to product or SaaS lifecycles. In a world where brands in the United States compete with the spectacle of mega‑projects in the United Arab Emirates and the visionary giga‑events emerging across Saudi Arabia, every physical gathering becomes an opportunity to win loyalty and revenue. A well‑built journey map visualizes each event attendee journey touchpoint, records the emotion a guest feels during every interaction, and shows your team exactly where data should be captured.
Brands that formalize these visual blueprints routinely outperform those that wing it. A study by FullStory found organizations see an average lift of 13 to 22 percent in return on investment when they adopt journey mapping as an operational habit. Likewise, a widely quoted McKinsey & Company analysis connects even modest customer‑experience improvements to 2 to 7 percent revenue hikes and 1 to 2 percent profit gains. Multiply those percentages by the billions flowing into experiential marketing and you have a compelling reason to map before you build.
The pages that follow walk through the three macro stages of any live or hybrid production – pre‑event, on‑site, and post‑event – and then provide a practical template you can customize. Along the way, you will see field‑tested tips, regional snapshots from the United States and the Gulf, and technology suggestions drawn from the project teams at Chameleon Interactive. By the end you will have a toolkit to design cohesive, data‑driven experiences that delight audiences and lift your bottom line.

1. The Business Case – Why Customer Journey Mapping Matters Right Now
1.1 Experiential Momentum and Global Budget Growth
-
In North America, Fortune 500 brands are allocating between 20 and 30 percent of their annual marketing spend to live and hybrid shows, pushing the experiential category ahead of search advertising in total dollars.
-
Across the United Arab Emirates, government initiatives such as Dubai’s Expo Legacy Program and Abu Dhabi’s Culture and Tourism schemes are co‑funding immersive festivals to attract global travelers.
-
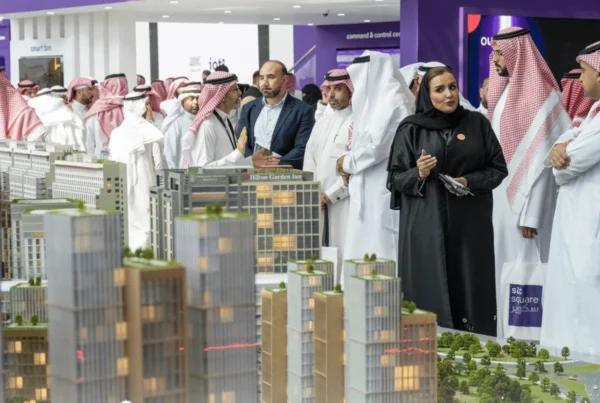
In Saudi Arabia, the Vision 2030 framework is igniting a wave of giga‑events like Riyadh Season, with multi‑million‑dollar pavilions and on‑site activations that rival anything in Las Vegas or New York.
The stakes are rising everywhere, and your event may compete against architecture‑scale LED façades or drone light shows that make headlines. A clear journey map ensures every guest feels the red‑carpet treatment even when you do not have a nine‑figure budget.
1.2 Four Concrete Reasons Journey Maps Outperform Ad‑Hoc Planning
-
Alignment with commercial objectives – By tying each moment to a measurable key performance indicator, you connect budget approval to revenue responsibility.
-
Friction removal – Journey maps highlight common pain points such as congested check‑in corridors or vague parking guidance, so you can solve them before doors open.
-
Data consistency – When the same identity token flows from a registration email to an RFID wristband and then into the CRM, your attribution models sing.
-
Continuous insight loop – Post‑event analytics cycle back into product teams, giving your next campaign a head start.
Forrester’s list of common journey‑mapping pitfalls – executive apathy, siloed data, and lack of governance – can all be neutralized by making these four advantages non‑negotiable success criteria.
2. Laying the Groundwork – Pre‑Event Planning and Persona Prep
Your event may last a single evening in Manhattan, a three‑day summit in Dubai World Trade Centre, or a week‑long roadshow that finishes in Riyadh. Regardless, the attendee journey starts the moment someone sees a promotion. That means pre‑event planning is the first chance to impress.
2.1 Define Objectives and Key Performance Indicators
Begin with goals that tie directly to revenue or impact. Common examples include:
-
Registrations – absolute number, plus percentage of target persona segments.
-
Qualified leads – marketing qualified and sales qualified leads generated on‑site.
-
Average dwell time – crucial for exhibitions and pop‑up retail where time equates to spend.
-
Net Promoter Score – the emotional pulse of your audience and an early retention predictor.
Lock these metrics before your creative team drafts a single storyboard.
2.2 Assemble Rich, Multi‑Dimensional Personas
Borrow frameworks such as ITA Group’s persona canvas or combine registration data with behavioral insights from prior events. A mature persona is multi‑dimensional:
| Attribute | Example Entry – United States | Example Entry – United Arab Emirates | Example Entry – Saudi Arabia |
|---|---|---|---|
| Age Band | 28‑34 early‑career decision maker | 35‑45 mid‑career expatriate leader | 24‑30 local entrepreneur |
| Primary Motivation | Networking & career acceleration | Access to global thought leaders | Technology inspiration |
| Content Preferences | Tactical breakout labs | Futuristic keynote spectacles | Success stories of regional startups |
| Pain Point | Time‑poor and conference fatigue | Visa logistics for regional trips | Limited previous exposure to similar activations |
With personas in place, you can write email subject lines, social countdown posts, and on‑site scripts that resonate.
2.3 Audit the Full Pre‑Event Touchpoint Ladder
| Stage | Touchpoint | Journey Goal | Optimization Idea |
|---|---|---|---|
| Awareness | Paid social advert | Spark first interest | Localize creative – skyscraper imagery for UAE, NYC skyline for US |
| Consideration | Registration microsite | Convert browsers to sign‑ups | One‑click sign‑up via LinkedIn or Apple ID |
| Preparation | Confirmation email | Set clear expectations | Embed personalized agenda builder |
| Excitement | Countdown microsite | Sustain buzz | Offer AR filter that places user at future exhibit booth |
| Logistics | “Know before you go” text | Reduce anxiety | Geo‑target traffic alerts and parking QR passes |
Pro tip: If you are shipping a headline installation like a mixed‑reality tunnel, tease it in augmented reality through the lens of a phone. Our step‑by‑step blueprint in Immersive Solutions 101 Guide explains how to keep file sizes under 5 MB and avoid app downloads.

3. Crafting Peak On‑Site Engagement – Phygital Flow and Tech Enablement
At the show, a guest finally meets your brand in person. A well‑mapped on‑site sequence removes friction points, stages emotional peaks, and captures high‑quality data without feeling intrusive.
3.1 Build a Step‑by‑Step Flow – Arrival to Exit
-
Arrival and Check‑in – Consider walkability in major US convention centers like McCormick Place, plus ride‑share drop‑offs common in Dubai and Riyadh. Fast‑lane QR codes reduce queue anxiety.
-
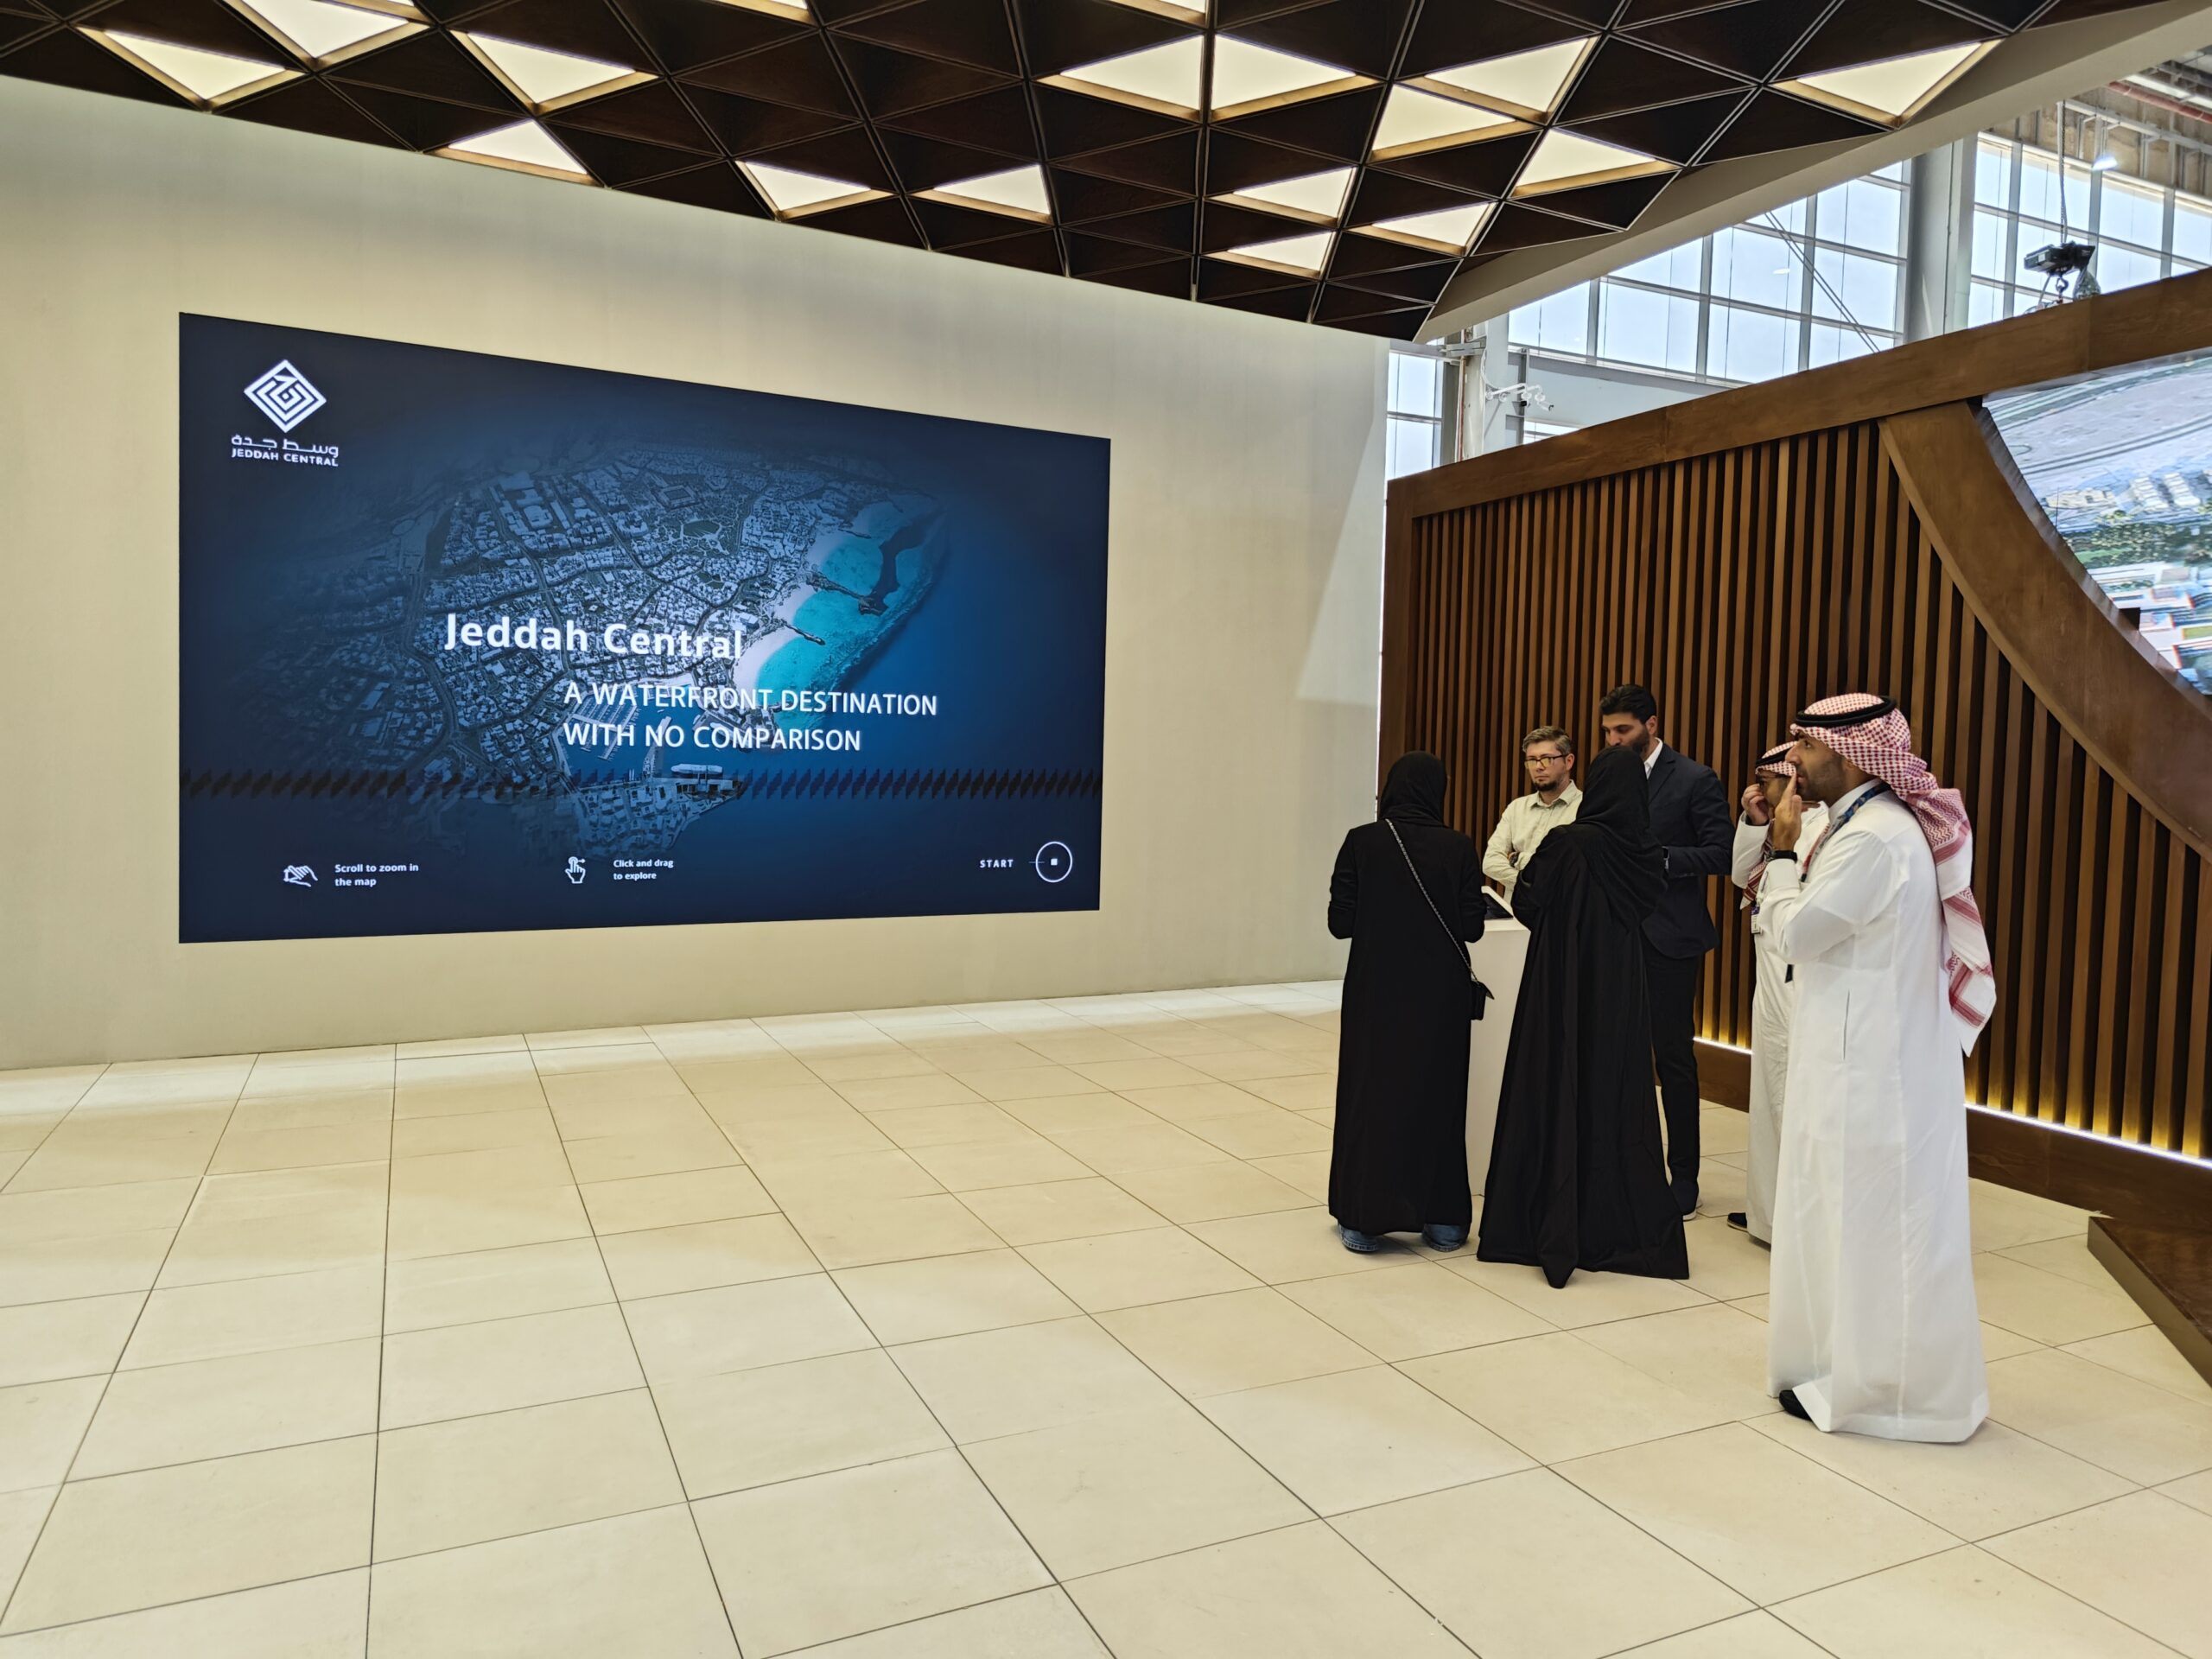
Orientation Zone – Giant LED walls display real‑time heat maps, guiding guests toward less crowded entrances.
-
Core Activations – RFID, NFC, or ultra‑wideband tags trigger content based on persona, capturing dwell time automatically.
-
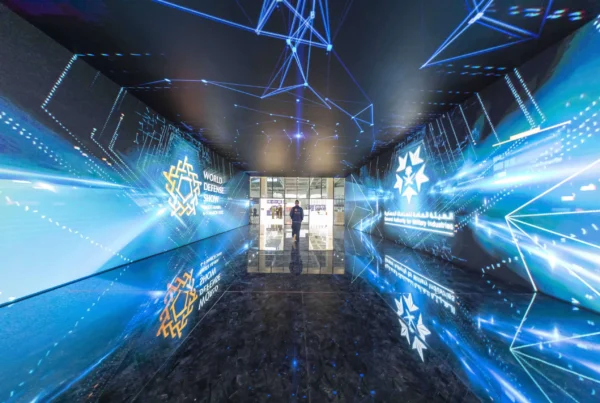
Surprise Peaks – Plan a moment of awe such as an LED tunnel reveal.
-
Reflection Pods – Quiet lounges with tablet feedback kiosks offer a decompression zone while generating survey responses.
3.2 Technology Stack for Immersive Event Experience
| Technology | Benefit | Tip |
|---|---|---|
| Interactive event technology kiosks | Hands‑on demos boost dwell time | Link each kiosk to a unique CRM field for attribution |
| Projection mapping on architecture | Spectacle without physical construction | Factor in desert dust calibration for UAE outdoor venues |
| XR demo booths | Converts curiosity to product memory | Sanitize headsets every 20 uses for high US health‑code compliance |
| AI photo booths | Organic social reach via branded shareables | Whitelist region‑approved social media APIs in Saudi Arabia |
| Live heat‑map dashboards | Crowd flow optimization | Have security teams monitor spikes in real time |
Budgets continue to grow. The IPA Bellwether Report shows an eleventh consecutive quarter of experiential budget expansion across both North America and the Gulf. The board expects accountability, so bake data capture into the architecture.
3.3 Accessibility and Inclusivity Keep Guests Engaged Longer
-
Apply WCAG 2.2 contrast ratios on every screen to help attendees under bright Riyadh sunshine.
-
Add tactile floor paths, especially for large halls in Las Vegas or Abu Dhabi where carpet color changes may not suffice.
-
Provide local‑language captioned audio streams – English, Arabic, and if your personas demand, simplified Chinese.
3.4 Ethical Data Capture – Privacy by Design
Guests in California are protected by CCPA, while guests in Dubai rely on DIFC Data Protection Law, and Saudi attendees come under the Personal Data Protection Law. Collect consent visibly, explain value exchange, and provide easy opt‑out links in every communication.
4. Post‑Event Follow‑Up – The Revenue‑Multiplier Stage Too Many Forget
The show may end, but the journey is midway. The first 24 hours after departure deliver the highest open, click, and conversion rates.
4.1 The 24‑Hour Golden Window
Send a thank‑you email topped with a personalized highlight reel, resource links, and a one‑click survey. Endeavor Business Media reports that immediate surveys generate response rates up to 18 percent higher than those sent after two days. Segment respondents who praise a keynote or spotlight a pain point for targeted follow‑up.
4.2 Multi‑Step Nurture Journeys and Segmentation
Borrow from Endeavor Business Media’s nurture framework and set an automation flow that mirrors on‑site behavior. If a guest spent fifteen minutes in your sustainability pavilion, route them to content on eco‑friendly supply chains.
Sample nurture timeline:
| Day | Channel | Content |
|---|---|---|
| 1 | Thank you, highlight reel, VIP resource pack | |
| 3 | SMS or WhatsApp | Micro survey with two emoji taps |
| 7 | Deep‑dive article, white paper download, on‑demand demo calendar | |
| 14 | LinkedIn DM | Invitation to exclusive roundtable |
| 21 | Early‑bird ticket for next year or next city stop (Jeddah, Chicago, Austin) |
4.3 Measurement and Attribution
Tie journey outcomes back to revenue:
-
Pipeline velocity – New opportunities created and days to next stage.
-
Earned social reach – Track user‑generated content tagged with your event hashtag across Instagram, TikTok, X, and Snapchat (popular in the Gulf).
-
Net new first‑party opt‑ins – Compare to the size of your initial registration list.
-
Closed‑won deals influenced – Attribute revenue to engagement tiers, correlating RFID scans with CRM opportunity IDs.
By showcasing these numbers, you transform journey mapping from a design exercise into a quarterly board metric.
5. Building Your Customer Journey Map – A Practical Template You Can Use Today
A classic swim‑lane diagram contains five columns: Stage, Touchpoint, Attendee goal, Internal owner, and Metric. If you prefer a turnkey file, download a free template from UXPressia.
Below is a miniature example for orientation. Replicate for each stage and persona until you cover the full timeline.
| Stage | Touchpoint | Attendee Goal | Internal Owner | Metric |
|---|---|---|---|---|
| Orientation | Mobile agenda builder | Confidence they will not miss sessions | Product marketing | Agenda creations per registrant |
| Core activation | LED tunnel immersive intro | Shareable wow moment | Creative director | UGC posts tagged with event hashtag |
| Reflection | Quiet feedback lounge | Quick expression of sentiment | CX manager | Survey completions on‑site |
| Follow‑up | Thank‑you email | Continued value, next steps | Demand generation | Email click‑through rate |
Export your map into Miro or Figma so stakeholders across time zones – from San Francisco to Dubai to Riyadh – can co‑edit. Schedule monthly reviews and overlay new analytics in a different color.
6. Common Pitfalls and How to Avoid Them
| Pitfall | Prevention Tip |
|---|---|
| Siloed data repositories | Deploy an experience data platform that pipes badge scans, app clicks, and survey results into a single dashboard. |
| Executive indifference | Tie two journey metrics directly to forecasted revenue, then present updates every two weeks. |
| Inside‑out content creation | Validate every agenda idea with a persona panel of at least five target attendees. |
| Accessibility gaps | Run WCAG audits and venue walkthroughs with a representative user who has mobility or visual challenges. |
| Over‑engineered maps | If a touchpoint lacks a metric, owner, or attendee goal, remove it until you can justify resource allocation. |
7. Regional Notes – Tailoring Your Customer Journey Map for United States, UAE, and Saudi Contexts
7.1 United States: Data‑Rich but Privacy‑Sensitive
Californians expect frictionless digital integration yet enforce stricter data rights. Utilize single sign‑on and progressive forms to shorten registration while offering explicit opt‑in checkboxes. Public venues have robust ADA requirements, so ensure physical accessibility is mapped thoroughly.
7.2 United Arab Emirates: Spectacle First, Comfort Always
Dubai and Abu Dhabi audiences live in a cityscape where the average mall features a dancing fountain show. Your on‑site itinerary needs at least one jaw‑dropping moment, but do not neglect climate control and hydration stations. Consider bilingual Arabic‑English signage, plus efficient valet or ride‑share lanes for VIPs.
7.3 Saudi Arabia: Vision 2030 and Cultural Nuance
Mega‑events like Riyadh Season create expectations for immersive storytelling tied to national transformation. Align your narrative with themes of innovation and cultural heritage. Allocate prayer areas and schedule sessions to respect local customs. Ensure male and female attendee flows respect any gender‑specific venue rules.
8. Conclusion – Customer Journey Mapping as an ROI Engine
Customer journey mapping for experiential events is more than a sticky‑note exercise; it is an operational playbook that converts creative spark into measurable revenue gains. By scripting every experiential campaign touchpoint – from the first teaser email to the final follow‑up call – you remove friction, multiply shareable moments, and capture data that drives pipeline velocity. Studies put the upside at up to 22 percent improved returns. Our clients in the United States, United Arab Emirates, and Saudi Arabia have seen those gains firsthand, turning once‑per‑year summits into year‑round growth engines.
Ready to plot your own map and watch the numbers climb? The consulting team at Chameleon Interactive can facilitate a one‑day workshop, integrate interactive event technology, and deliver a dashboard that proves impact. Reach out, and let us co‑author an immersive event experience that wins hearts – and revenue targets.
Frequently Asked Questions
1. What is customer journey mapping for experiential events?
Customer journey mapping for experiential events is a strategic process that visualizes every interaction an attendee has before, during, and after your show. By documenting each experiential campaign touchpoint, planners can design a seamless event attendee journey that maximizes satisfaction and data capture.
2. How does customer journey mapping increase event ROI?
A complete map links every touchpoint to a measurable goal, removes friction such as slow check‑in, and aligns marketing automation with on‑site data. When executed correctly, organizations often see a 13 to 22 percent lift in revenue because they convert more leads and avoid missed sales opportunities.
3. Which touchpoints should be included in an event attendee journey?
Key stages cover pre‑event engagement strategy (ads, registration microsite, confirmation emails), on‑site experiential activation (arrival, orientation, core installations, feedback zones), and post‑event follow‑up tactics (thank‑you emails, surveys, nurtures). Mapping all three phases ensures no moment is left unmanaged.
4. What role does interactive event technology play in on‑site experiential activation in the United States, United Arab Emirates, and Saudi Arabia?
Interactive event technology such as RFID wearables, LED tunnels, and XR demo booths elevates the immersive event experience while silently collecting first‑party data. Whether your show is in Las Vegas, Dubai, or Riyadh, these tools create shareable wow moments and provide the analytics needed to prove success.
5. How soon should post‑event follow‑up begin after an experiential campaign?
Initiate your first thank‑you and resource email within 24 hours of the event’s close. Early outreach captures fresh sentiment, encourages rapid survey completion, and funnels attendees into automated nurture paths that turn engagement into measurable sales growth.